Genixly team
-
March 12, 2026
The Single‑Prompt Lie: Why Your LLM Visibility Screenshot Is Not Data
Lear more
Create a GEO workflow that combines the action engine and re-testing in a control loop, turning LLM visibility measurement into AI search optimization.

Below, we focus on the GEO workflow that determines whether your LLM visibility measurement turns into influence. While many teams track AI search analytics by monitoring answer volatility, exporting dashboards, and comparing competitors, nothing really moves in terms of GEO. And the problem is not a lack of data. The absence of a structured measurement-to-action loop is what makes other optimization efforts useless.
See, the problem is that GEO cannot function as a tracker because visibility metrics respond to structural changes in content, positioning, grounding, and constraints. Instead of that, it must function as a control system that follows a disciplined loop: Map → Measure → Diagnose → Act → Re-test.
In this article, we dive deep into why dashboards create false confidence in AI search optimization and what actually makes sense in GEO. You will learn how to create a true GEO workflow with playbooks instead of vague recommendations and why designing verification-grade re-tests is crucial for it. If you want LLM visibility to change rather than just be reported, this guide reveals the difference. For more insights on improving your LLM visibility, visit our Complete GEO Framework.
There lots of new GEO tools, tutorials, and all possible initiatives all over the Internet, but something is wrong with many of them. First of all, they are relatively new and lack the necessary experience which is not very bad and can be easily justified by the novelty of the discipline of answer engine optimization. In addition to that, many of them incorporate SEO systems as a foundation. While it cannot be justified in any case, it is still not the worst thing about today’s GEO tools. What worries us the most is that many modern GEO tools stop at measurement.
Even if your dashboards track LLM visibility, answer volatility, Path Win Rate, Decision Capture Rate, routing quality, sentiment drift, and other parameters, it still guarantees nothing. Because when charts move, the system generate reports, and screenshots start circulating internally, nothing really happens from the perspective of your brand’s position in AI-generated answers. That’s what we call the dashboard trap.
In traditional SEO, dashboards are still significant because rankings are relatively stable, traffic correlates with position, and optimization is incremental. But GEO is entirely different. In AI search, visibility is probabilistic, conversation-based, and structurally volatile. Observing it without structured action is like watching weather data without ever adjusting the forecast model.
Although a dashboard tells you what happened, it never tells you what to change. In GEO, however, measurement is only the middle of the process — not the end. So, you are doomed if your workflow ends with “We appear 38% of the time” or “Competitor X replaced us in 12 prompt families.” Then you’ve diagnosed symptoms without designing an intervention.
At this point, most AI search analytics tools leave the stage. They highlight volatility, but never explain whether it’s entity confusion, missing attributes, weak proof assets, or context collapse. They measure routing, but never tell you which offer element triggers marketplace preference. Although modern GEO dashboards surface signals, you are the only person who connects the dots.
However, observation without leverage becomes the burden where you should do the hard work. In some cases, it may even be harmful because you can obtain a false sense of progress, which is a trap. To prevent this issue, you need a real GEO workflow, which is a control loop rather than a dashboard. Here is the main difference between the two:
But how does the correct GEO loop look? Let’s define one in the next section.
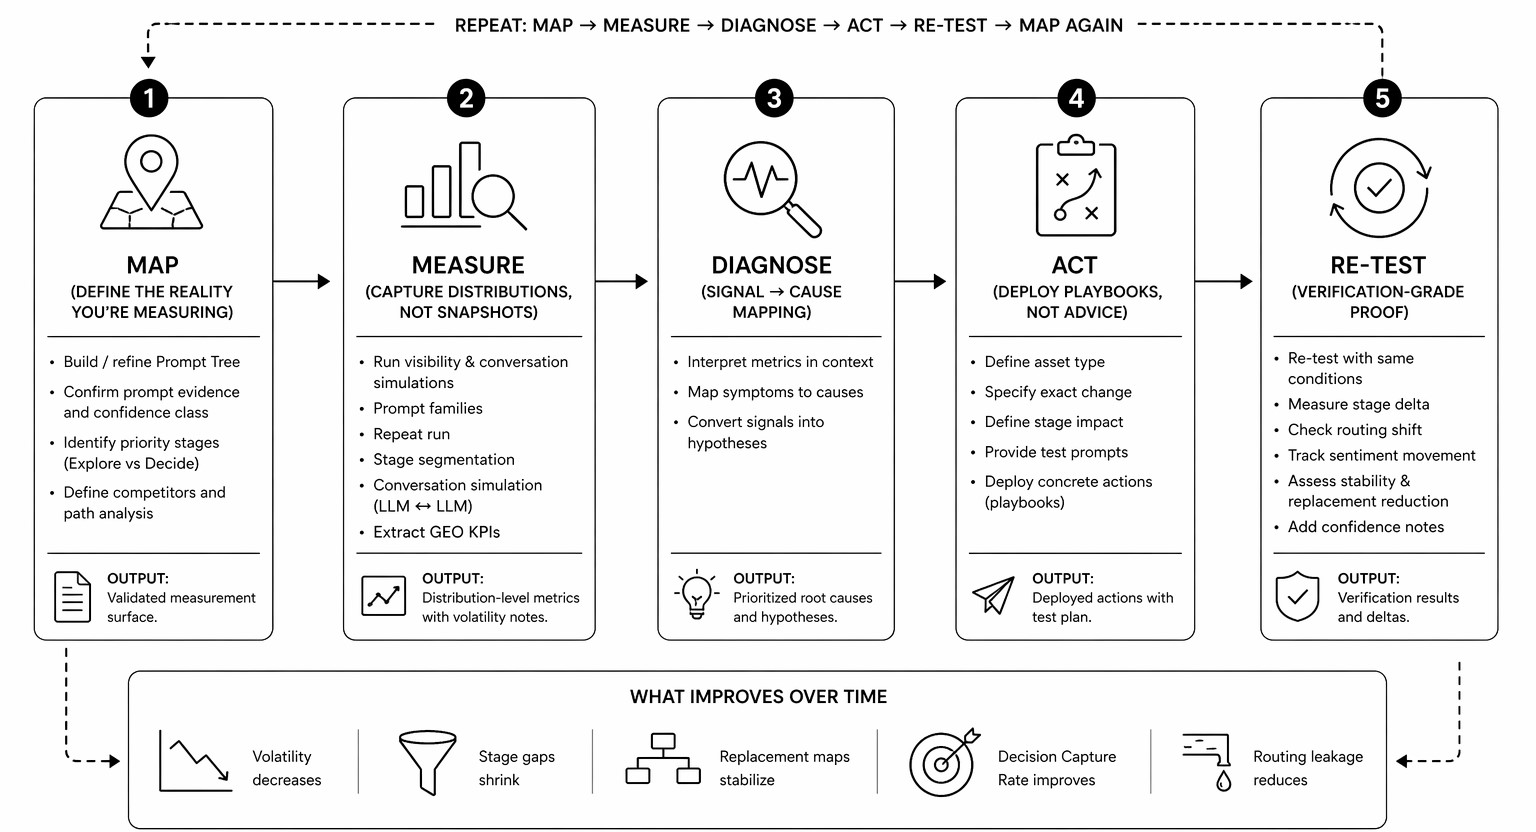
If we treat GEO as a control loop rather than a dashboard, the next step is to agree on its structure. The good news is that it is rather simple, containing these 5 elements:
Map → Measure → Diagnose → Act → Re-Test.
Each stage here exists for a reason, and removing any of them will collapse the system, leaving you with either noise or theater. So, let’s explain each part of the correct GEO workflow, to prove their importance.
Mapping is the very first stage that defines the decision reality you want to influence. This is where Prompt Trees, journey stages, and conversation simulation coexist. Without mapping, you are testing random prompts rather than evaluating your brand’s position in answer engines.
Mapping is so important because it answers in which decision paths you expect your brand to appear and why.
Skip this stage, and measurement becomes anecdotal and never shows you the true way of things.
Measurement is the second logical stage that turns mapped intent into distributions.
At this point, you test prompt families, simulate conversations, observe replacements, track context tags, record routing outcomes, and quantify answer volatility. In other words, you move beyond snapshots to discover patterns.
Measurement answers another fundamental question: Across realistic paths, how often do we show up — and in what position?
Without this answer, everything is just a mere assumption.
Also, note that most modern GEO tools stop at this point, when 3 more stages are ahead.
The Diagnose stage is a phase when the system connects the dots. Yes, it should be your GEO tool rather than your team (which may still be involved because nobody denies human expertise), connecting signals to structural causes.
From the GEO standpoint, this stage helps you discover various things. For instance a low Path Win Rate might reflect weak category anchors, high answer volatility might indicate entity confusion, marketplace routing might signal missing trust assets, negative framing might reveal citation imbalance, and so on.
In simple terms, diagnosis is a bridge that connects visibility metrics to intervention. It answers why something happens inside the model’s reasoning.
Remove the diagnosis, and guess what? Your GEO turn into guesswork.
Now that you are familiar with the diagnosis, it’s time to act. In the correct GEO workflow, action means deploying specific playbooks. Therefore, a vague piece of advice like “create better content” is useless. What really means at this stage is a step with a detailed description based on the previous stages. For instance, clarifying pricing constraints, adding risk-reversal assets, publishing canonical comparisons, and so on.
What’s common for all these actions is that they always evolve around the same question: What structural change will alter the model’s retrieval logic?
Skip this stage, and you are bound to dashboards forever.
Since you always have to measure the impact of changes, the re-testing stage becomes an integral part of the GEO workflow.
However, comparing distributions before and after the change requires a special protocol. You need to freeze prompt families and control for model and locale. The goal is to interpret deltas under volatility and with confidence notes.
The re-testing stage answers whether the model’s behavior actually change after the changes were applied earlier.
And without re-testing, optimization is nothing more than storytelling.
This is how the Map → Measure → Diagnose → Act → Re-Test loop transforms GEO from monitoring into control. While dashboards observe systems, the control loops, like the one we offer, introduce the only way to change them. And below, we break down the most misunderstood parts of that loop — diagnosis, action playbooks, and verification-grade re-testing.
Unfortunately, diagnosis is the Achilles heel in the GEO workflow for most teams because they still follow the good old SEO logic, thinking that diagnosis is relevant to explaining the metric. In GEO, however, it has a more complex meaning:
And the “model’s reasoning environment” is what makes things different and complicated. In practice, you need to take signals, such as a low Path Win Rate, a high answer volatility, a marketplace routing, or anything else that you explore, and map them to the thing that cause them. Without it, your GEO actions become random.
Therefore, it crucially to remember that a metric does not explain itself. For instance, if you lose at the Decide stage, the problem is not “low Decide-stage presence.” That’s the symptom. But what’s the cause?
There may be multiple reasons, such as pricing ambiguity, lack of comparison positioning, weak trust assets, absence in third-party lists, stronger competitor grounding, and so on.
Similarly, if answer volatility is high, the cause is not “the model is unstable.” It may be fragmented positioning, inconsistent naming, thin attribute coverage, or retrieval ambiguity that skyrockets the volatility.
Consequently, you need a correct diagnosis to separate structural weaknesses from statistical noise. And it, first of all, requires context.
One of the most common mistakes associated with diagnosis is interpreting a single metric in isolation. Consider Path Win Rate. If your Path Win Rate is 26%, that number means nothing by itself. Is 26% strong or weak? It depends.
Now add context:
Suddenly, the signal becomes clear: your brand is discoverable and considered, but it collapses when the model must choose.
While the isolated metric hides the structural weakness, the contextual view reveals the stage-specific coverage. Therefore, it is important to understand that context in the GEO workflow has multiple facets:
Without context, metrics either produce anxiety or a false sense of success. With context, however, they offer the possibility for diagnosis, which, in turn, transforms GEO from reporting into action. And it is the pivot point between measurement and leverage.
If the correct diagnosis identifies the cause, true GEO action must change the system. But this is another crashing point for many workflows. Even if it happens that a team diagnose the root of the cause correctly correctly (“weak Decide-stage presence,” “missing citations,” “low Path Win Rate under constraints,” etc.), general actions may become what prevents it from real results. In such a complex system as LLM, generic actions as create more content, add proff, or strengthen positioning provide little to zero impact.
Moreover, you should consider them intensions rather than actions. In GEO, however, even good intentions are not enough. What the correct GEO workflow truly requires is deploying a defined playbook tied to a specific signal.
A GEO playbook must never be a suggestion. On the contrary, it is a structured, repeatable intervention designed to change how the model retrieves, frames, or routes your brand. Consider these examples of Signal/Playbook pairs as examples of sufficient actions that truly impact the way model thinks:
In this example, each playbook maps directly to a cause. There is no generic content production and abstract “brand improvement” that most modern GEO tools enjoy so much.
Observability is another essential component of the Action stage of our GEO workflow because if you cannot specify what changed, you cannot re-test it. Such piece of a vague advice as “Improve trust” is not actionable. “Add third-party citations from X list, include compliance badges, and update the FAQ to address objection Y” is.
Therefore, the action stage must be based on the following pillars:
From this, we assume that the correct GEO workflow always ensures all actions are always surgical in a control loop.
Take playbooks out of the GEO workflow equation, and you are doomed to react emotionally to volatility. While one bad run may not trigger much panic, two of them may force you to make hasty decisions.
Using playbooks, however, stabilizes the response because you receive an instrument to convert metrics into predefined execution paths:
Thus, right actions not only remove guesswork but also let you make informed decisions and create the background for meaningful re-tests.
We insist that GEO re-testing is not a formality. In fact, it is the only way to verify the impact of actions taking in in a control loop. And it is associated with a few very important nuances.
Verification-grade re-testing in GEO requires you to fix a bunch of parameters, such as:
What should be different then? The answer is pretty simple: only the changed asset. So, you apply a change, wait a while, and run the same test that you used to discover the problem. If you alter prompts, models, and constraints simultaneously, you cannot attribute the delta to your intervention.
The goal of re-testing in GEO is to detect the shifting patterns. You are not doing all these to win one answer. Instead, you are looking for increased Path Win Rate across relevant families, higher Decision Capture Rate at the Decide stage, reduced answer volatility, fewer competitor replacements, improved routing quality, stabilized contextual framing, and so on.
From this perspective, a single favorable output is just noise. The only thing re-testing is worth doing for is a consistent distribution. For instance, the initial testing shows the following results:
The same metrics after intervention:
Now you have a signal and proof that your presence in AI-generated answers has been improved. And it has happened not because the model liked you more this time, but because structural inputs changed its reasoning.
False causality in GEO looks as follows: You publish new content → Two days later, you see a positive answer → You assume improvement. LLM systems, however, are volatile by design. It means that you can see a single positive answer even without applying any new changes. Without freezing variables and running proper re-tests, you cannot separate random variance, model updates, retrieval shifts, and true impact of your changes.
With verification-grade re-testing, your GEO workflow protects against this optimism bias. In a control loop, you always get the proof that your intervention either changed or did not change how the model understands, retrieves, frames, and recommends your brand.
Below is a one-page Control Loop SOP for the correct GEO workflow that you can actually implement.
The Control Loop SOP is not linear. It repeats: Map → Measure → Diagnose → Act → Re-test → Map again
If you do it right, the following things shift over time:
That is what real GEO workflow looks like. Not a bunch of dashboards. Not a folder with screenshots. It’s a system that runs constantly, learns, and adjusts. To learn about other elements of the GEO control loop, follow this link: AI Search Optimization to Move LLM Visibility.
GEO only works when it behaves like a system. Stop at measurement, and you will remain with uncertain visibility reports. Stop at diagnosis, and you will only come up with theories. Stop at action without re-testing, and you will stack with random activity, which may be useless.
But when you connect Map → Measure → Diagnose → Act → Re-test into a disciplined control loop, something changes; visibility becomes influence, volatility becomes a signal, and metrics become directional rather then descriptive.
This shift is what guides you from dashboards to leverage. While a dashboard tells you where you stand, which is fairly enough for standard SEO, a control loop makes you move, which is essential for GEO. And from the perspective of AI search, that difference is existential. Because LLMs reward structured clarity, grounding, constraint alignment, and decision-stage presence. And those qualities only improve when measurement feeds directly into verified action.
From this standpoint, the Control Loop SOP is not a productivity trick. It is an operating model for GEO that forces you to:
That discipline is what separates AI search analytics from AI search optimization. And if your workflow ends with a screenshot, you’ve come to the right place. Its time to replace your tracker with a control loop. Contact us now to learn more about Genixly GEO and how it incorporates the Map → Measure → Diagnose → Act → Re-test loop.
Our blog offers valuable information on financial management, industry trends, and how to make the most of our platform.

